New videos on how to understand and analyse IATI data
New videos launched on using IATI’s Country Development Finance Data tool.
Read more
To search for organisations and projects in IATI data, see IATI data access tools
The IATI Secretariat has explored how to use IATI Datastore Search, together with the Country Development Finance Data (CDFD) tool, to identify funding that saves lives.
On the occasion of the 25th anniversary of the adoption of the Ottawa Mine Ban Treaty ¹ (December 2022), the analysis presented in this article uses data available in IATI to demonstrate how activities, relevant to the mine action sector, can be extracted from IATI’s Datastore Search. It then uses the filtered activities to present an overview of the global budget and spending data in mine action through IATI’s CDFD tool. By making available real-time comprehensive data on mine action resource flows, this information can be directly accessed by stakeholders looking to fill data gaps and coordinate resources towards life-saving activities to mitigate the threat of explosive hazards at country-level.
this information can be directly accessed by stakeholders looking to fill data gaps and coordinate resources towards life-saving activities to mitigate the threat of explosive hazards at country-level.
IATI data is published by more than 1,500 organisations and covers over one million development and humanitarian activities across the world. Users of IATI data commonly need real time information on resource flows for specific development and/or humanitarian activities. This up-to-date information is crucial for informing effective decisions and coordination of development resources which are essential in the face of humanitarian crises. With this wealth of information published to IATI, how can data users access and make best use of the data to focus on specific themes or topics?
The purpose of this article is to showcase the kind of analysis that can be achieved through both IATI’s Datastore Search simple search engine to locate relevant activities in a particular theme or topic, and the power of CDFD to then filter the relevant activities into pre-processed financial data to enable easy analysis of budgets and spending.
After using Datastore Search’s simple search engine to query relevant/technical keywords related to ‘mine action,’ ² the search returned nearly 3,000 mine action-related activities and over 55,000 financial transactions published in IATI³. The IATI identifiers returned by Datastore Search, that are unique to each activity published to IATI, were then found and filtered out in the data available from CDFD in order to pull pre-processed transaction and budget data to begin a landscape analysis of resource flows in mine action⁴.
With the processed IATI data that is available in CDFD, users can analyze resource flows in mine action to comparatively assess budget and/or spending data across recipient countries, while also pinpointing data gaps and the quality of activity reporting being published by reporting organisations to IATI. The graphs provided below are just a few examples of how the pre-processed data from CDFD can be analysed.
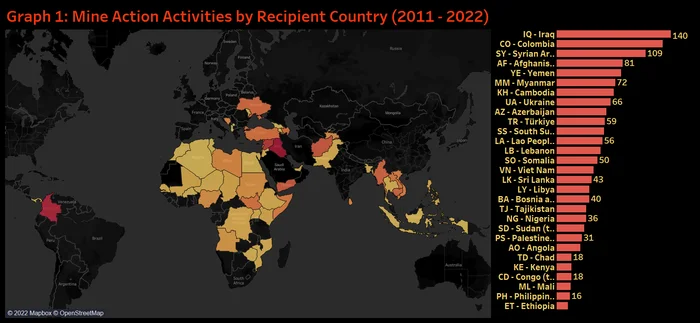
Graph 1: Mine Action Activities by Recipient Country (2011 - 2022)
we can begin to piece together a global landscape analysis that offers insights into where activities are being carried out by organisations working on mine action
From Graph 1 (Mine Action Activities by Recipient Country 2011 to 2022), we can begin to piece together a global landscape analysis that offers insights into where activities are being carried out by organisations working on mine action. According to the activity-level data published to IATI, Iraq is recorded as the largest Recipient Country of mine action activities since 2011 (140 activities), followed by Colombia (130). Activity-level information is also useful for providers to develop better understanding of the landscape of projects to connect activities that may have similar objectives or goals. For example, diving deeper into Iraq’s activity-level information, in the Graph 2 (Iraq Activities List) screenshot we can ascertain just from the ‘titles,’ detailed locations and areas of focus⁵. As illustrated from the screen shot below, the US Government has funded a range of mine action activities in Iraq that range from ERW clearance in Anbar province and Iraqi Kurdistan, to incorporating mine risk education in projects for Countering Violent Extremism (CVE). We can also identify that Tetra Tech is the largest Receiver Organisation of USA spending towards mine action in Iraq. Likewise the UN Mine Action Service (UNMAS) is the largest Receiver Organisation of mine action funding from both the UK and Germany in Iraq⁶.
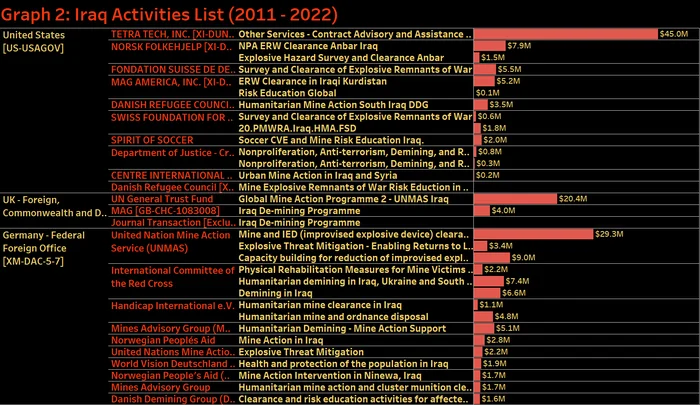
Graph 2: Iraq Activities List (2011 - 2022)
Beyond activity level information, stakeholders can use the pre-processed financial information generated in CDFD to analyse IATI data on commitments, disbursements, and expenditures, as well as forward-looking budgets which are presented simply by country and region. The graphs below develop our mine action query further to assess and compare (over the years) resource flows dedicated for mine action by using the financial data available in CDFD.
For example, in Graph 3 (Overall Spending for Mine Action) we can first zoom out to assess global resource flows in the activities to instantly see a snapshot of the spending data available in IATI from 2011 to 2022. From 2016 onwards, there is significant year over year growth in financial reporting for mine action in IATI, reaching a high point in 2019 with a total spending value of $832 million. It is worth noting that with the establishment of the Grand Bargain during the World Humanitarian Summit in 2016⁷, key humanitarian actors made several commitments to improve the quality of humanitarian funding data which may partially explain the substantial increase in financial reporting for mine action related activities in IATI. In addition, as some publishing organisations update their spending data to IATI on a monthly or quarterly basis, resource levels for mine action in 2021 and 2022 are likely to be substantially higher when those reporting organizations update their spending data in IATI.
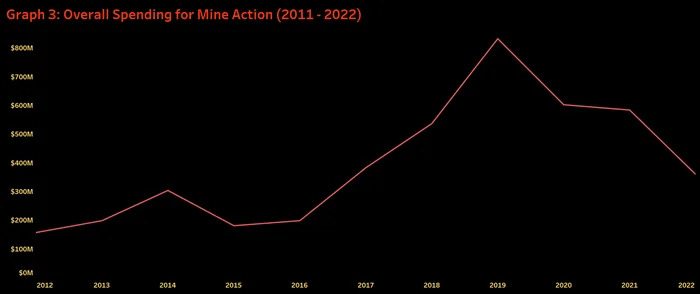
Graph 3: Overall Spending for Mine Action (2011 - 2022)
IATI data can be used to evaluate where resources are being allocated by Recipient Country, while also providing information on how those resources are being allocated in those countries at the sector-level. For example, in Graph 4 (Mine Action Spending by Recipient Country and Sector), Iraq has received the lion’s share of mine action funding reported to IATI since 2011, with Reporting Organisations publishing over $423 million in spending⁸.
IATI data can be used to evaluate where resources are being allocated by Recipient Country, while also providing information on how those resources are being allocated in those countries at the sector-level.
This result may be unsurprising, given Iraq is considered to be the world’s most heavily contaminated country by extent of mine area according to the Landmine Monitor. However, the data published to IATI validates the assumption that mine action resources are being channeled to those countries most impacted by explosive hazards. Moreover, we can also assess by Recipient Country where those resources are being spent at the Sector level. As shown in Graph 4, the “Government and Civil Society” Sector for Iraq, Yemen and Afghanistan has received the most spending, whereas in Syria, the majority of spending for mine action has been channeled to the “Emergency Response” Sector. The Sector Categories shown below are based on the OECD (Organization for Economic Cooperation and Development) DAC 3-digit code list for sectors⁹.
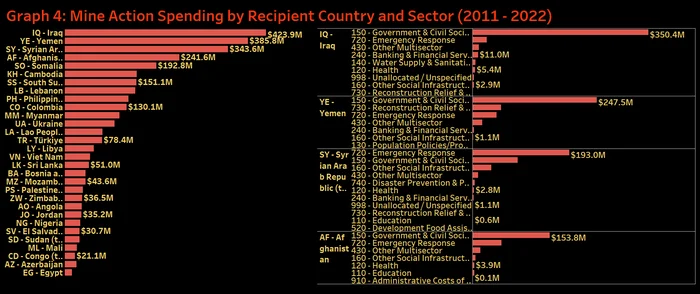
Graph 4: Mine Action Spending by Recipient Country and Sector (2011 - 2022)
IATI data can also offer valuable real-time insights into the Organisations reporting the most financial data in a Recipient Country. Funders and country-level stakeholders need a good understanding of the landscape of providers in order to fill data gaps and coordinate resources towards life-saving activities, such as mine action. From Graph 5 (Mine Action Spending by Reporting Organisation in Iraq), Germany, the USA, Canada and Sweden have reported the highest levels of spending towards mine action related activities in Iraq since 2011.
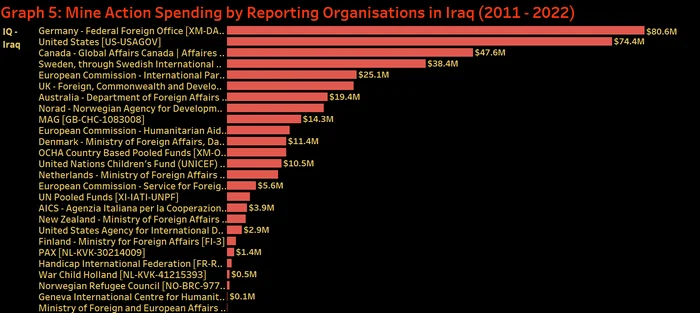
Graph 5: Mine Action Spending by Reporting Organisation in Iraq (2011 - 2022)
Zooming out at the global level to visualise spending across Reporting Organisations, Graph 6 (Mine Action Spending by Reporting Organisation) shows that UNICEF is the largest provider of mine action related programming with over $345 million in recorded spending over the last decade. On the other hand, when comparing spending with the number of mine action activities (in the right column), we can see that UN OCHA and the US Government have published the most activities which could be an indication that either the global range and operational tempo of their resource allocations in mine action are much higher; or, this could be more related to how the they are defining “activity” in their publishing to IATI.
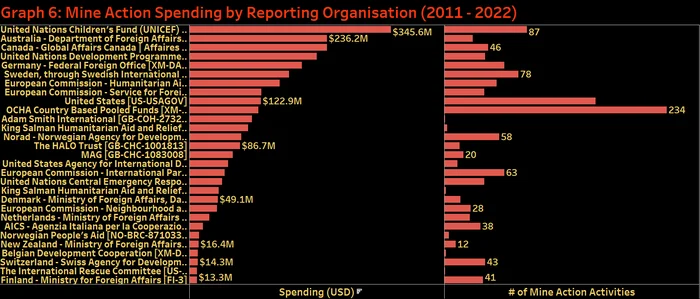
Graph 6: Mine Action Spending by Reporting Organisation (2011 - 2022)
We can also dive deeper to begin developing individual profiles of the Reporting Organisations to determine where the majority of their mine action spending has been allocated by Recipient Country. For example, in Graph 7 (Reporting Organisation Profile) and Graph 8 (UNICEF’s Provider Organisations) we can see in which Recipient Countries UNICEF has recorded the highest levels of spending, and the major providers of UNICEF’s mine action funding.
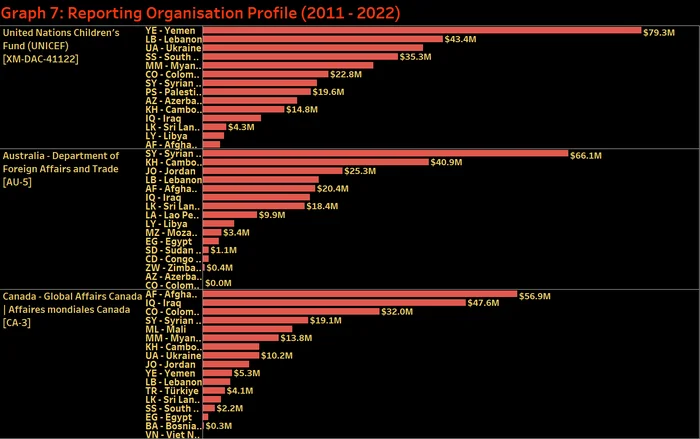
Graph 7 : Reporting Organisation Profile (2011 - 2022)
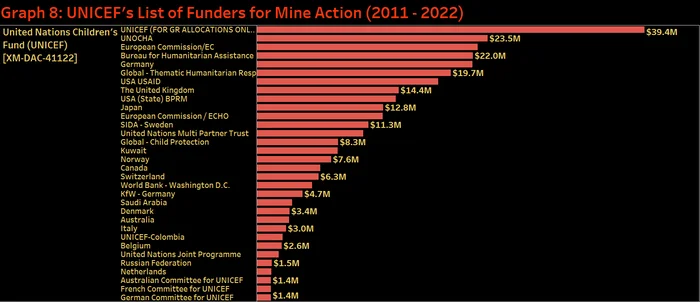
Graph 8: UNICEF’s Provider Organisations (2011 - 2022)
In the spirit of the Ottawa Mine Ban Treaty, the breadth of Canada’s support in mine action is epitomized in Graph 9 (Canada’s Mine Action Profile 2011-2022). From spearheading efforts to support complex IED clearance operations in Iraq; towards community resilience projects in Syria that mitigate the threat of explosive hazards for the local population; to building the capacity of Ukraine’s humanitarian demining capacity in Eastern Ukraine; all of these further substantiate Canada as one of the leading providers in the mine action sector.
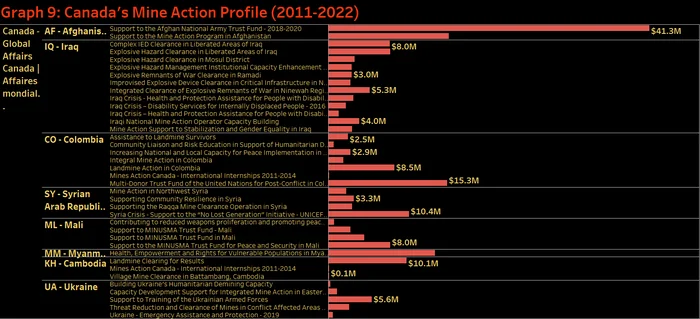
Graph 9: Canada’s Mine Action Profile (2011-2022)
Users of IATI data can develop a comprehensive landscape analysis, in real time, on a range of development and/or humanitarian themes. Through both IATI’s Datastore Search simple search engine to locate relevant activities in a particular theme or topic, and the power of CDFD to then filter the relevant activities (3,000 activities and 55,000 financial transactions) into pre-processed financial data, we were able to instantly assess resource flows and comparatively assess spending data for mine action across from a range of different angles.
IATI data for mine action is one of many examples in which the data can be used by stakeholders to fill data gaps to enable development and coordinate resources towards life-saving activities. IATI as a global initiative will continue to bring together governments, multilateral institutions, private sector and civil society organisations and others to improve the transparency of development and humanitarian resources and their results for addressing poverty and crises.
(NEW) CDFD instructional videos (available in English, French, Spanish and Portuguese):
(NEW) Datastore Search demonstration
Connect with fellow data users
¹ Officially known as the Anti-Personnel Mine Ban Convention (APMBC), the Treaty prohibits the use, stockpiling, production and transfer of antipersonnel mines. It is the most comprehensive international instrument for eradicating landmines and deals with everything from mine use, production and trade, to victim assistance, mine clearance and stockpile destruction. There are 164 States Parties to the treaty, States not party to the Mine Ban Treaty include: China, Egypt, India, Israel, Pakistan, Russia and the United States.
² The following keywords were used in the IATI Datastore’s simple search engine: “mine action” “risk education” “victims assistance” “explosive ordnance” “explosive remnants of war” “ERW” “improvised explosive device” “IEDs” “explosive hazards” “landmine” “demining” “de-mining” “humanitarian mine action” “humanitarian demining” “explosive hazard clearance” “survey and clearance." Using the Simple Search will perform a full-text search on every narrative element within IATI data, including whether the search terms are present in the activity titles, activity descriptions, transaction descriptions, results data etc. For a summary of all elements within the IATI activity standard, including all narrative elements, please see our Activity Standard Summary Table; For additional information on how to use IATI Datastore Search, please see the latest demo provided here: https://iaticonnect.org/topic/recap-demo-datastore-search
³ After running a quality check on the activities extracted from the Datastore Simple Search, false positives were identified. For example, the simple key word search returned World Bank activities that were unrelated to mine action; however, the simple search still returned those activities as the Bank’s Financial Agreement safeguard language incorporates key words from our search: “A borrower (or recipient) shall ensure that any area in which civil works under the Project will be implemented has been cleared of Explosive Remnants of War.” In these instances, the activities were excluded from the analysis. In another specific example, a World Bank project output had used the same acronym as our search term for ‘IEDs’, though to mean Intelligent Electronic Devices (“IEDs) and hence unrelated to mine action.
⁴ It should be noted Data Quality issues were identified for specific publisher organisations: For example, the International Committee for the Red Cross (ICRC) is known to be a staple actor in the humanitarian mine action sector (particularly through its Weapons Contamination Unit); nonetheless, ICRC’s data could not be incorporated into this analysis given the aggregated nature of the organisation’s activity level reporting and the internal vocabulary tagging which made comparability of the data difficult while making it unfeasible to identify funding flows attributable towards mine action.
⁵ Graph 2 is a screenshot of activities from three major bilateral donors in Iraq (USA, UK FCDO, and Germany). There is much more activity data available in IATI for Iraq and for other countries!)
⁶ The d-Portal ‘URL’ for each activity can also be accessed which allows you to easily see detailed information about individual activities; including the results data and whether the activity is still active or is closed, among other statuses.
⁷ The Grand Bargain, launched during the World Humanitarian Summit in Istanbul in May 2016, is a unique agreement between some of the largest donors and humanitarian organisations who have committed to get more means into the hands of people in need and to improve the effectiveness and efficiency of the humanitarian action.
⁸ The $500 million in disbursements, and $332 million in reported expenditures for 2019 are aggregated together to calculate spending. To assess spending, it is recommended to aggregate ‘disbursement’ and ‘expenditure’ transaction types together. As both transaction types capture several types of resource flows, aggregating these for a particular reporting organisation (for example, the World Bank) should not result in double counting. To understand more about how budgets and spending data in IATI can be assessed, please see Analysing IATI data to understand 2022 budgets and spending.
⁹ For more information on the methodology behind sector categorization in IATI; please refer to the CDFD guidance and methodology. Please also refer to the from the OECD.Stat website for the lexicon of sector codelists.