d-portal improvements provide more useful IATI data
In 2019 discover more useful information on development and humanitarian spending by exploring new features added to IATI’s search tool d-portal.
Now, users can easily identify what activities are being delivered in humanitarian crises, the sectors they are being delivered in and the specific type of transactions being made.
Now, users can easily identify what activities are being delivered in humanitarian crises, the sectors they are being delivered in and the specific type of transactions being made. These new features have been added alongside many other updates, fixes and cosmetic changes throughout the site to meet requests made by d-portal users.
Start your search at d-portal.org now
Discover humanitarian activities
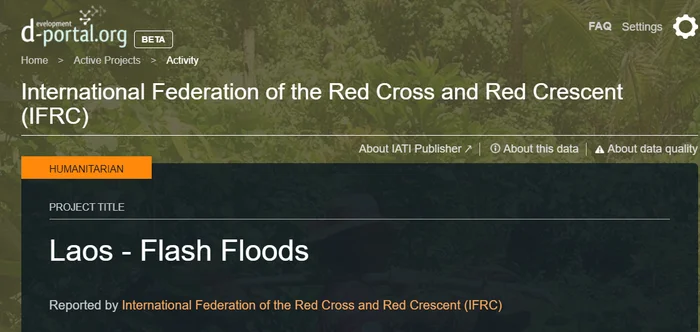
d-portal now displays a ‘humanitarian’ flag on all activities that organisations have said they are delivering in response to a humanitarian crisis. From donors to implementing partners, anyone can use the ‘humanitarian attribute’ when publishing data relating to humanitarian assistance.
Users can find the ‘humanitarian’ flag displayed on d-portal’s activity viewer:

Humanitarian flag displayed on IFRC's activity published on responding to flash floods in Laos
Publishers can also report whether individual transactions (and not the whole activity) are addressing a humanitarian crisis. In these cases the flag is displayed within the transaction table:

Humanitarian flag displayed on War Child Holland's disbursements to partner organisations
Transaction types
Transaction data is one of the most detailed pieces of financial information that can be reported to IATI. This data describes individual transfers of finance between organisations.
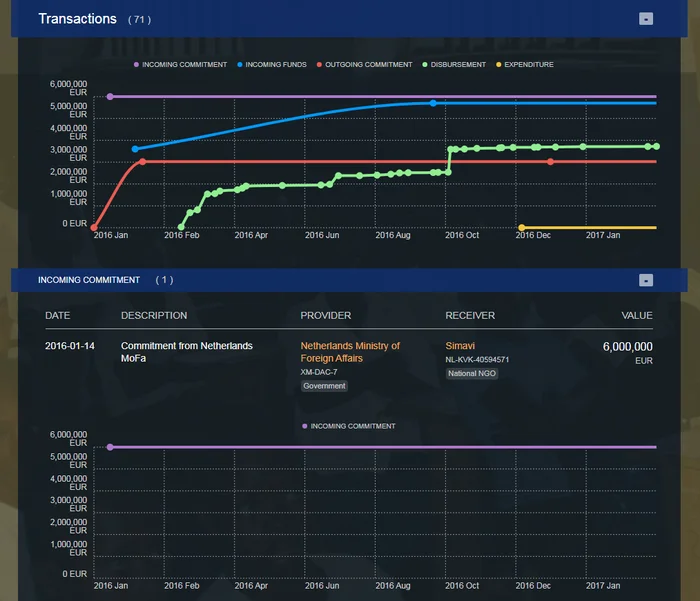
When reporting data, organisations can indicate which category their transaction falls under and now d-portal provides graphs showing different transaction types within a given activity. For example, an organisation can distinguish whether a transaction has involved them receiving monies or giving it to another organisation.

Graphs showing transaction data published to IATI by Dutch NGO, Simavi
Each transaction type has been assigned a colour and transactions are merged if they are published for the same date.
Within the overview graph, users are also now able to compare what funds an organisation has committed (outgoing commitment) and they have actually spent (disbursement and expenditure).
Country and sector graphs
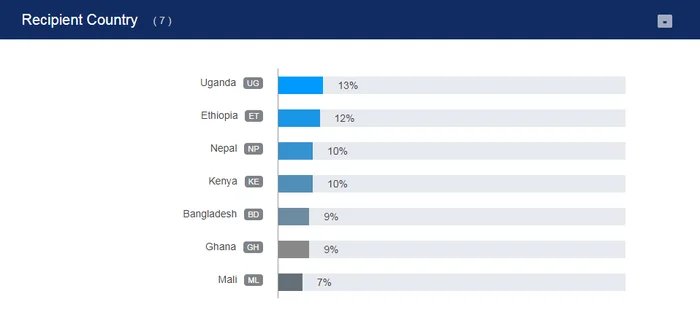
New bar graphs have replaced the pie charts that were previously used to show an activity’s sector and country information. The new bar graphs make it easier to visualise the data in relation to percentages. The 2-digit country codes and sector codes used to identify the individual categories have also been included in the graphs and charts:

% resources of an activity going to each recipient country

% resources of an activity going to each sector
CSV downloads now includes more sector data
Additions have been made to the CSV data download feature, allowing users to now extract data specifying the sectors and sector groups (DAC 5- and 3-Digit codes) to which the activities belong.
Displaying organisation type and unique identifiers
Organisations’ unique identification codes and the type of organisation they belongs to (for example ‘International NGO’) are now included in more areas in d-portal. This key information is included when viewing a list of participating organisations involved in an activity.

List of organisations participating in Worldwide Hospice Palliative Care Alliance's activity working towards universal health coverage in Bangladesh

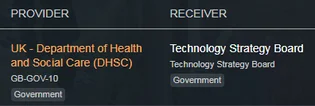
The organisation type and unique identifier have also been added to the provider and receiver organisations under transactions and planned disbursements. This provides users with more context of an activity.
Other additions, updates and fixes
To read about more updates and fixes that have been implemented throughout the site see d-portal’s news section: ‘New year, new features and additions’.
Continuous improvement
IATI is continually working on more ways to ensure people can access the data they want through d-portal. Please share any suggestions you have via GitHub or email [email protected].