Common searches on the Dashboard
The IATI Dashboard contains a wealth of information. This guide takes you through some common queries performed by the IATI Secretariat. These queries can be adapted to cover different elements, attributes and metadata.
The IATI Dashboard provides metrics on XML errors and which elements and attributes are being used by which publishers. This data can be aggregated to show the total number of activities published on a particular day or separated so that you can see how many times an organisation has reported a title in Arabic, for example.
The examples of common searches below provide a method for navigating the Dashboard and finding the statistics you are looking for. You can adapt these searches according to the data you are looking for.
Which organisations publish a particular element?
You will need to know the name of the element you are searching for and where in the Standard it gets reported. This is because some elements appear multiple times in different places. For example, results in IATI all get published within a <result> element.
- On the Dashboard you need to go to the ‘Exploring Data’ section.
- Select ‘Elements’. Here you will see a list of the different elements and attributes in the IATI Standard.
- To see which organisations are using an element, click on the number in the second column.
You will see all of the publishers using the element and how many times it occurs in their data. The Publisher IDs for each organisation are on the left. Clicking on the ID will take you to the publisher’s Dashboard page. Clicking on the ‘Files with Element’ number will take you to their files.
In this example, you are provided with a long list of publishers using the <result> element.
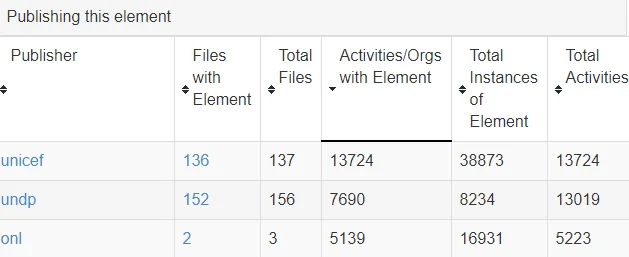
List of organisations publishing a <result> element
Which organisations publish a particular codelist?
You will need to know which codelist the code is from, and where in the standard it gets reported. For example, an organisation is publishing SDG Targets if they declare code 3 on the TAG Vocabulary codelist. This gets reported in the @vocabulary attribute within the <tag> element.
You will see all the values on the codelist that are being used. Hovering over the number of publishers will give you the Publisher IDs for the organisations using the value. Click on the Publisher ID to be taken to that organisation’s page on the Dashboard.
In this example, UNDP is using code 3 which is the SDG Target codelist.
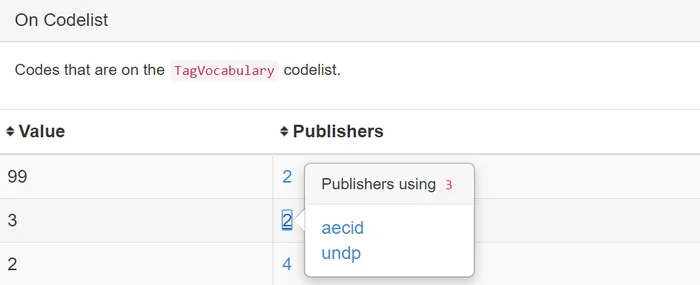
List of organisations publishing SDG Targets
On a particular codelist, what are the most commonly used codes?
You will need to know which codelist you are wanting codes from, and where in the standard they get reported. For example, document format codes come from the File Format codelist. These get reported in various @format attributes within <document-link> elements.
You will see all the values on the codelist that are being used. Select the ‘Publishers’ heading at the top to arrange the column in size order.
Now you can see which of the codes are most commonly used. For the File Format codelist, the top entry is application/pdf.
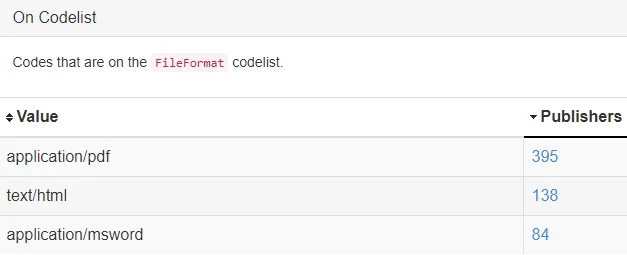
List of commonly used document types
How can I find a list of all version 1 publishers?
- On the Dashboard, go to the ‘Data Quality’ section.
- Select ‘Versions’.
- Here you will see graphs displaying the use of different versions (expected and other) over time. Below this you can find a list of publishers who have at least one file at a particular version of the IATI Standard (expected and other).
- These lists and the data behind them can be downloaded in a JSON format. Where you see (j) highlighted in blue, this will also take you to a JSON download of the data.
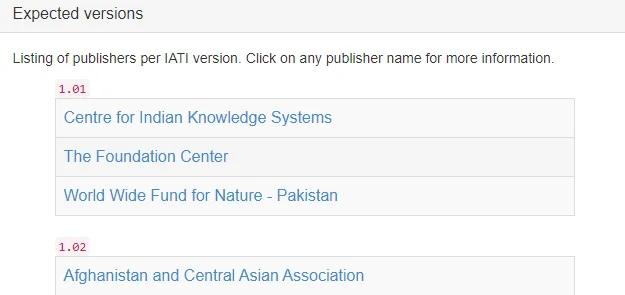
List of organisations with version 1 data
What are the duplicated activity identifiers in an organisation’s data?
- On the Dashboard, go to the ‘Data Quality’ section.
- Select ‘Duplicate Identifiers’. Here you will see a table of all the duplicate activity identifiers found in IATI data.
- Find the organisation you are looking for. Clicking on either number will take you to a JSON file containing the identifiers and how many times they occur within the organisation’s published files.
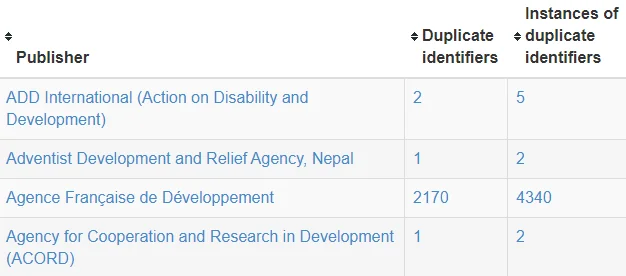
List of organisations with duplicated identifiers
How many activities was an organisation publishing on this date?
- On the Dashboard Home page, scroll down until you see the list of all IATI publishers.
- Select the publisher you are interested in e.g. United Nations Development Programme (UNDP)
- The ‘Activities’ graph displays how many activities the organisation was publishing over time.
- Download the data on which the graph is based, in JSON format, by clicking on (J) at the top right of the graph.
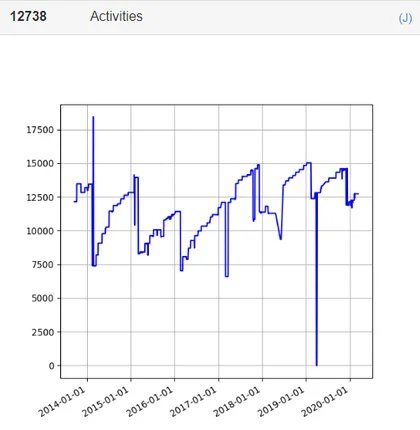
UNDP's activity count over time